 |
The main difference between IMC and SIMC is that IMC has effective scattering while in SIMC
photons quickly stream through the problem and feel the full toll of absorption. Since
relatively small changes, as a function of the position coordinate, are occurring in the
middle of the slab while a high rate of change exists near the boundaries, it makes sense to examine
the effects of zone refinement and spatial biasing. We will first examine geometric zoning without biasing by making
the zone widths near the boundary thinner using a geometric progression, with a ratio,
![]() = 1.75, for adjacent zones
as discussed in Section 2.3. Smaller
zones are needed to resolve the atomic population near the surface of the slab where the
basic assumption of the numerical method, that the atomic population is constant within
the zone, is violated.
= 1.75, for adjacent zones
as discussed in Section 2.3. Smaller
zones are needed to resolve the atomic population near the surface of the slab where the
basic assumption of the numerical method, that the atomic population is constant within
the zone, is violated.
The upper atomic population is shown in Fig. 2 for the uniformly zoned case as well as for the geometrically zoned case. Only the first tenth of the slab is shown as the upper level atomic population does not change much past what is displayed. In this figure, it is clear that geometric zoning is needed to properly capture the shape of the upper level atomic population near the surface. To check the correctness of the numerical solution, we have estimated the atomic population near the center of the slab with an escape probability analysis[7] and have found that it agrees our Monte Carlo solution.
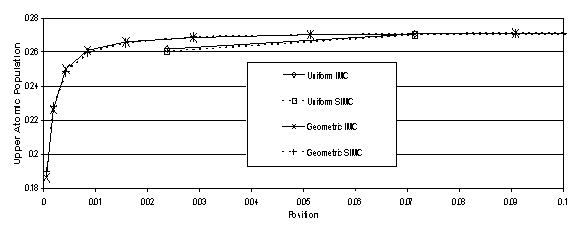
Figure 2:
Upper Atomic Population for Collisionally Pumped Trap Example
In Fig. 3, we show the standard deviation for the 100 problem instances used to produce the averaged results shown in Fig. 2. The noise envelope for SIMC is about a factor of 6 less than that for IMC on this problem, corresponding to a factor of 36 improvement in execution speed. Geometric zoning, without a compensating importance sampling, has increased the noise envelope near the border and has reduced it away from the surface, due to the relatively few particles born in the smaller zones.
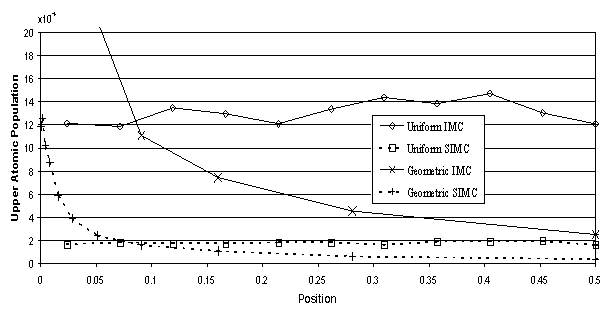
Figure 3:
Noise for Upper Atomic Population for Collisionally Pumped Trap Example
The exit spectrum for the collisionally pumped trap example is plotted in Fig. 4 as a function of frequency in units of Doppler widths for the geometrically zoned scheme. Uniform zoning is not shown as it is very poor due to teleportation errors as discussed in Sec. 2.5. While the uniform zone spectrum (not shown) for IMC is very noisy, it does give the correct frequency output shape since its effective scattering prevents photon teleportation. This figure shows that all three methods predict the same exit frequency distribution when geometrically zoned. IMC's plot is less accurate due to noise which will be discussed next.
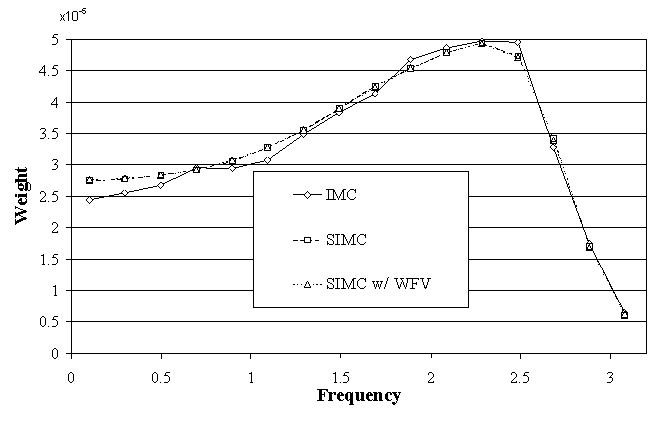
Figure 4:
Exit Frequency Distribution for Collisionally Pumped Trap Example
When examining the noise envelope for the frequency dependent output, as given in Fig. 5, SIMC with weight vectors begins to shine brightly. The noise to signal ratio for IMC and SIMC is independent of frequency below 2.5 Doppler widths, but then climbs sharply as the frequency is increased and the signal drops in the wing of the line. For SIMC with weight vectors, however, the noise to signal ratio drops rapidly with increasing frequency, maintaining a good statistical accuracy in the wing of the line. This happens because every photon carries spectral information deterministically in this method. This advantage can be very important if accurate problem output is required in the rarely sampled wing of the line.
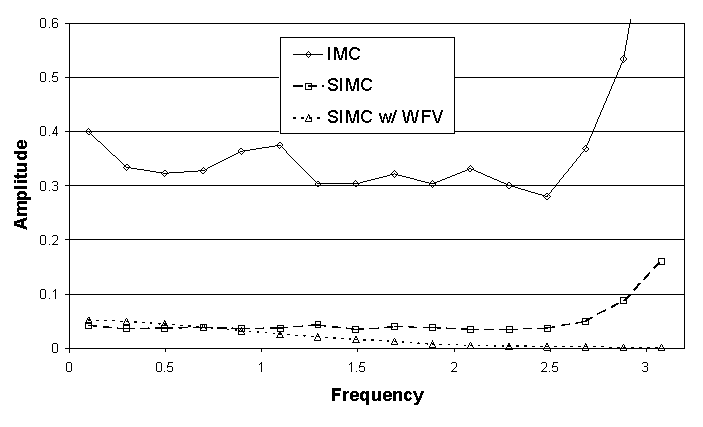
Figure 5:
Noise to Signal Ratio in the Emission Spectrum for Collisionally Pumped Trap
Example
When employing geometric zoning, with unbiased emission, the probability that a photon is born in the thin zones near the surface is quite small. Biasing allows for more sampling to occur in the thinner zones (where the upper atomic population is changing and the output spectrum is being influenced) and less in the larger zones (where very little is happening). The basic idea behind geometric zoning along with biasing is that regions that experience changes in upper atomic population are more important to development of the spectrum of transported photons. Therefore, they should be sampled more often in order to resolve finer structural details. This is accomplished by emitting a fixed number of particles per zone, leading to a geometric weighting that favors emission near the surface.
As a second step in importance sampling, we add subzone biasing in which particles are more likely to be emitted closer to a zone's edge. As with the reasoning behind geometric zoning with an equal number of particles emitted per zone, subzone biasing places Monte Carlo photons closer to the interface of a zone so that they will more likely cross into another zone and contribute to radiative transfer between zones. Monte Carlo photons born deep within a zone, at line center, lose a large amount of weight through attenuation before reaching a boundary and are therefore less important.
The effects of biasing are shown in the noise to signal ratio of Fig. 6. Comparing to Fig. 5, all three codes have improved their noise significantly at line center, at the cost of the noise becoming worse far from line center. SIMC with weight vectors, however, provides a uniformly low noise to signal ratio for the complete frequency spectrum. As a note, the effect of subzone biasing is not apparent here as the frequency spectrum is developed in the thin zones near the surface. Subzone biasing improves the frequency spectrum of photons crossing an interface deep inside the slab.
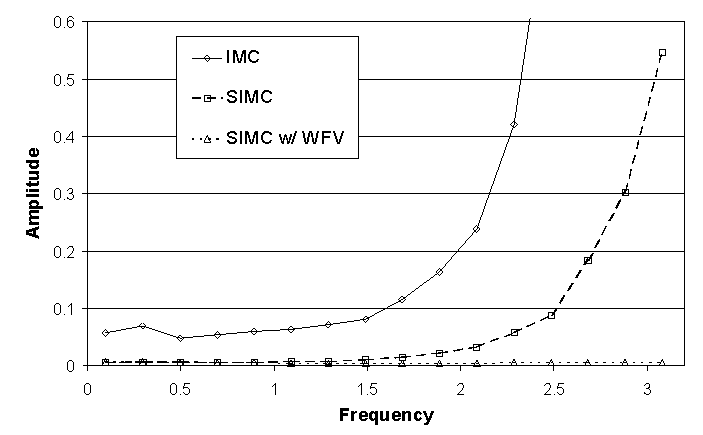
Figure 6:
Noise to Signal Ratio in the Emission Spectrum for Fully Biased Collisionally
Pumped Trap Example